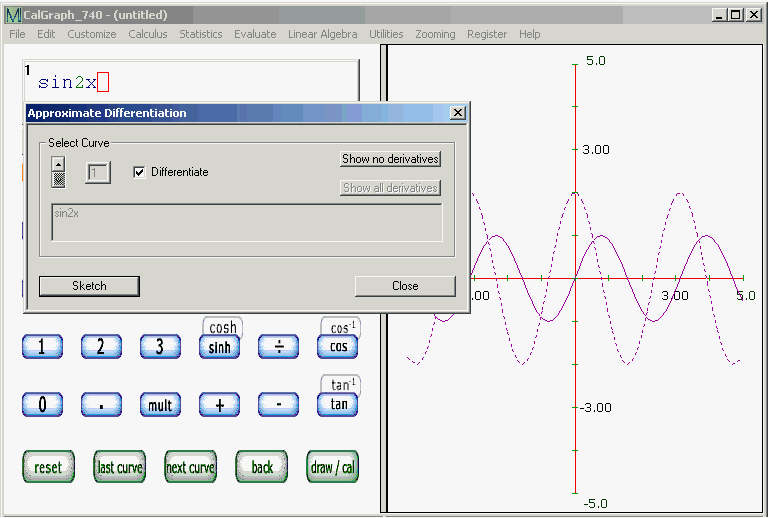
It can be helpful to see a function and of its derivative on the same graph. On the bar at the top of the CalGraph window, click Calculus and then Differentiate. The Derivative window opens.

There should be a Check ![]() in
the Differentiate box (if there isn't, click on it). Then click Sketch.
in
the Differentiate box (if there isn't, click on it). Then click Sketch.
Your original curve will be graphed, and its derivative will be there too. In my example, the original curve is sin(2x); it is written in the big grey box and its graph is the solid curve. The derivative is
2 cos(2x) and that is the dotted curve.
Often the derivative curve is not dotted. It can even be dotted some places but not in others. To see the dotted effect, click Customize > Curve Look and reduce the number of points to perhaps 60.
The derivative curve will be drawn with a thickness of 1, even if the original curve is set for a larger thickness.
I often set the curve thickness to 2 or 3 just so the curve and the derivative look different.
If you have several curves graphed, clicking Sketch draws the derivatives of all of them. Each curve and its derivative have the same color. If you no longer want the derivatives to show, click Show no derivatives and then click Sketch.
By clicking on the arrows ![]() and then checking or unchecking
the Differentiate box, you can draw some derivatives, but not others.
and then checking or unchecking
the Differentiate box, you can draw some derivatives, but not others.
The Close button will close the Differentiation window.
The window is labelled Approximate Differentiation because CalGraph finds the derivative using two points very close together to calculate the approximate slope of the curve.