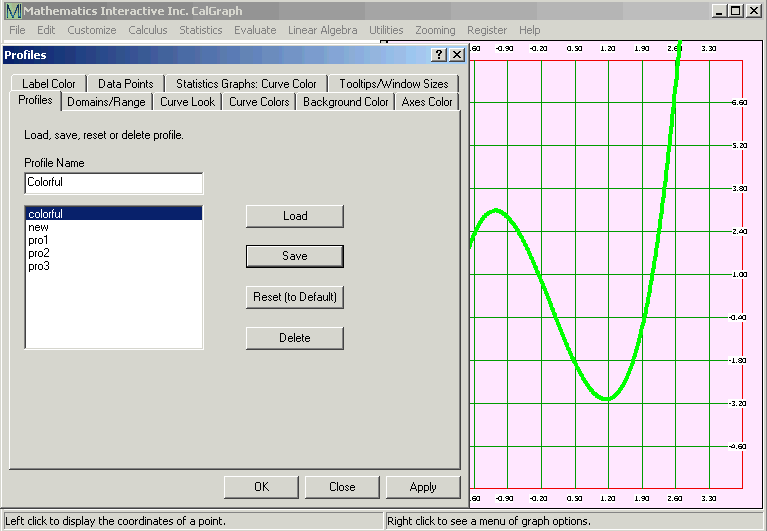
You may be doing a series of graphs, and want them to all have the same look. You can change the settings on each one as you do it, or you can set them once and save them, to use as needed. The look, the settings you save are called a Profile.
Here's how to set up your profile. Draw a graph, and hit draw/cal so you can see it. Hit Customize and use the settings there to set the Domain and Range, the Number of Points, Line Thickness, the Line Style and Kind of Axes, and the Colors. You could also decide if you want Tooltips to be visible or not, and adjust the size of the graph window.
Once you are satisfied with the look of the graph, click on Customize and then Open Profile. Type in a name for the Profile and click the Save button. The name for your profile appears in the list of Profiles.
I got a bit carried away doing the graph that follows. I set the Domain from -3 to 4, the Range from -6 to 8, the Line thickness to 4, the Axes to Boxed, the Curve Color to green and the Background Color to pink. I saved this profile with the name Colorful in case I want to use it again.

Go on working as usual, but whenever you want to use those settings again, click Customize and then Open Profile. Click the name of the profile, the Load button and then Apply or OK. All the settings are applied to the graph you are working on. You must click both Load and Apply.
You can have several different profiles available for use, just give them different names. You can delete one (click on it and then hit Delete).
The Reset (to Default) does just that
You can also adjust all the settings in the Customize > Open Profile window using the various tabs. They work just like the they do under Customize, except for Tooltips / Window Sizes which you adjust on the tab.
Be careful with the Save button on the Open Profile window. It does not save your graph, it saves whatever settings you have in whatever profile name is in the Profile Name box. It is easy to wipe out a profile this way.
The text you add to a graph is not part of the profile.