What follows is a (pretend) homework assignment, done using CalGraph.
Topics in Mathematics
Homework 1
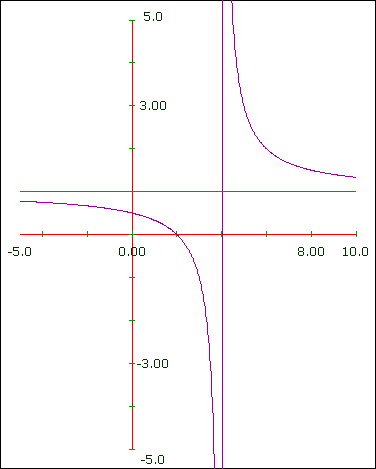
1) Sketch the graph of
![]()
Show the vertical and horizontal asymptotes.
Solution:
2) Sketch a graph showing these data and the straight line that best fits them.
Time 10 13 19 23 28
Money $50 $84 $139 $185 $225
What is the equation of that line ?
Solution:
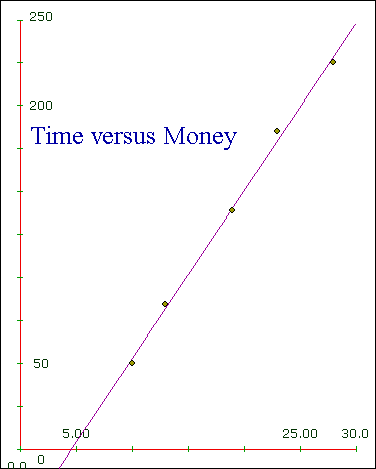
The line is y = 9.7757 x - 45.2298
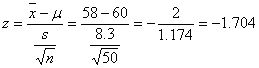
3) The Over Sixties club admits some
younger members
Solution: 50 is more than 30, so the mean has a Normal Distribution. The z-score is
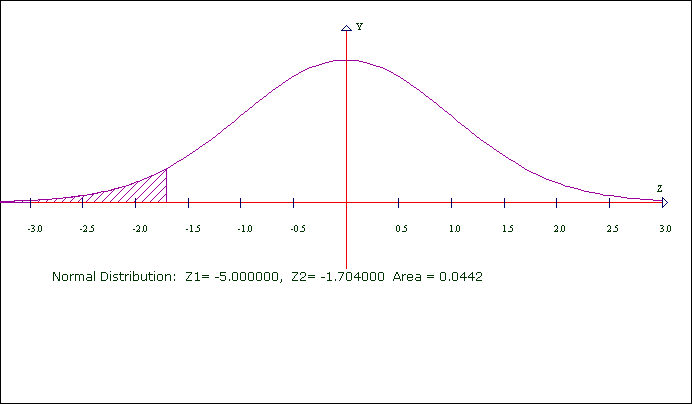
The area 0.0442 = 4.42% is less than 5%.
We fail to reject the null hypothesis.
We do not have enough evidence to say the club members average under 60.
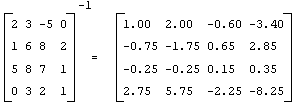
4) Calculate the inverse of
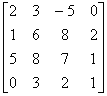
Solution:
How I did it:
In question 1, the formula was made with the Equation Editor in Microsoft Word. (Also in questions 3 and 4).
My first equation was y = (x - 2)/(x - 4). The second equation was y = 1 (the horizontal asymptote).
To center the graph better, under Customize > Curve Domains/Range, I changed the Xmax to 10.
To do question 2, I opened Microsoft Excel. In the first column I put 10, 13, 19, 23 and 28.
In the second column I put 50, 84, 139, 185 and 225. I saved the spreadsheet as Homework.xls and closed Excel.
In CalGraph, I clicked Linear Algebra > Polynomial Curve Fitting. I put Homework.xls in the Excel file box, and listed the Top Left as A 1 and the Bottom Right as B 5. A straight line has degree 1, so I put a 1 in Degree.
I clicked Sketch and it drew a graph. To make it pretty a bit, under Customize > Curve Domains/Range I changed the Xmin to 0 and the Xmax to 30. For the same reason I changed the Y-min to 0 and the Ymax to 250. I used Text to name the graph Time versus Money.
The formula for the line was in the first box of CalGraph.
For question 3, I used the Statistics > Normal Distribution. I hit Edit > Copy Graph to Clipboard and Pasted into this document.
Question 4 was done using Linear Algebra > Matrices. I entered the matrix and then hit the Inverse button. Then I clicked Edit > Copy Matrices to Clipboard and pasted into this document.