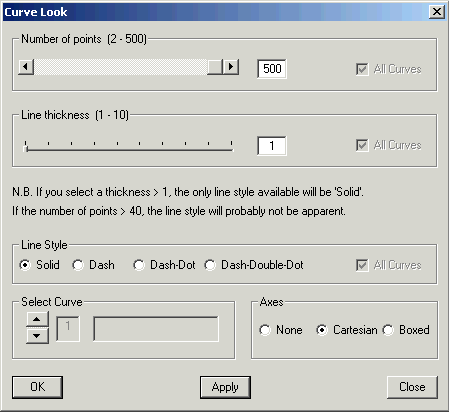
You can really change the way your graph looks. Click Customize and then Curve Look. This window opens:

The Number of points CalGraph uses to draw the graph can be changed by sliding the slider with your mouse, or by typing the number you want into the box beside it. Here it is set to 500, the maximum. Fewer points is quicker to calculate, but the curve may look more like straight lines joined together than a curve. Click the Apply button to see how the curve looks, and OK when you are satisfied.
The line can be made thicker by sliding the Line thickness slider with your mouse, or by typing the number you want into the box beside it. Here it is set to 1, the minimum. Click the Apply button to see how the curve looks, and OK when you are satisfied.
If you click File and Print to print the graph, you will notice that the line thickness is much less than what shows on the screen. If you click Edit > Copy to Clipboard to copy the graph into another program, the graph will look like what is on the screen.
If you click Calculus > Differentiate to add the graph of the derivative to the screen, the derivative line will have thickness 1 whatever setting you make for Line thickness.
You can make the curve a dotted line by clicking the Line Style you want. Only a thin line, a line with a thickness = 1, can be drawn dotted. If the number of points is large, the dotted effect is often not visible. Sometimes only part of the curve is dotted and the rest is solid. I find it helps to try different line styles and click Apply after each one. That way I can see just how the curve looks and decide what I like.
Different situations call for different ways of drawing the x and y Axes. Click None to have no axes visible, click Boxed to have a graph paper effect. Cartesian is what you click to get a horizontal x-axis and a vertical y-axis. Click Apply after each choice to see if you like the result. Once it looks the way you like, click OK.
If you are drawing several curves on the same graph, the different curves can have different line styles. Use the Select Curve box to do this. Click here to see a detailed example.