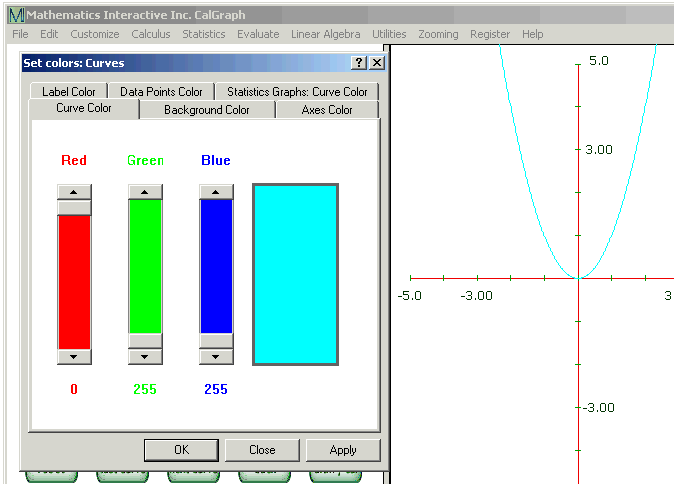
The colors of the different parts of the graph can be varied, pretty much any way you like.
Click on Customize and then Set Colors. The Set Colors Window opens.

There are 6 tabs at the top of the window; I clicked on Curve Color. I moved the sliders so the Red is at the top (0) and Green and Blue are at the bottom (255). This changed the box on the right to turquoise. I clicked on Apply and the Curve Color changed to turquoise.
All the Set Colors tabs work like this. Click on the tab of what you want to change, slide the sliders up and down to get the color you want and click Apply to see the result. Click OK and the window closes. If you don't click Apply, but hit Close, the window closes and the color is not changed.
The names of the tabs tell you what each one changes:
Curve Color changes the color of the graph line itself. If you have several curves on your graph, select which one to change using the arrows in the Select Curve box at the bottom of the window. Once one is the way you like it, you can select another curve and change its color too. Curve color does not affect the color of a Statistics graph.
Background Color changes the background. It is as though you put colored paper in the printer. This works differently for the Statistics graphs though; there it changes the color between the bell curve and the x axis only.
Axes Color changes the color of the x-axis and the y-axis.
Label Color changes the colors of the numbers on the x and y axis. It does not affect the color of text added to the graph.
If you have used curve fitting (under Linear Algebra), there are dots on your graph from the data in the Excel file. Use Data Points Color to change the color of these dots.
Statistics Graphs: Curve Color changes the color of the curved line in the graphs of the different Statistics Distributions (Chi Square, F, Normal and T).
If you wish to go back to original colors, click Customize > Restore Defaults
You can also change the colors of text written on the graph.