On the same graph, draw y = x3 and y = cos x.
Find where the two curves cross.
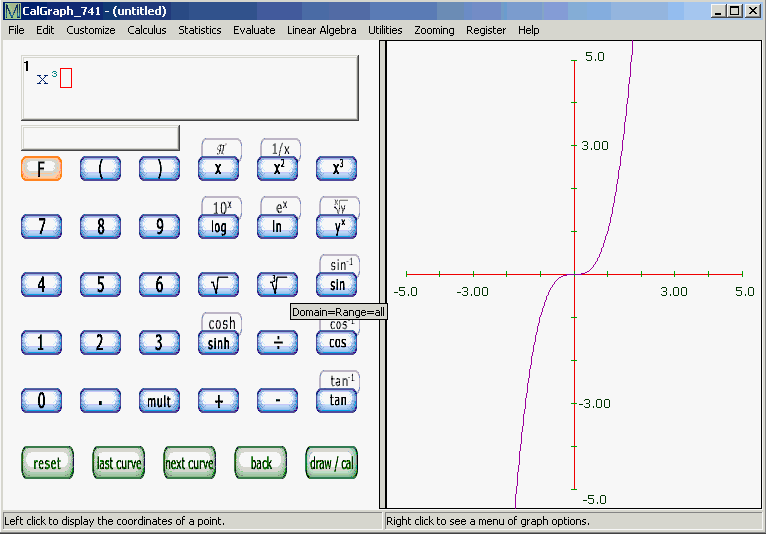
I begin with the first curve. I click on
![]()
and I get the first graph.

Now for the second graph. I click
![]()
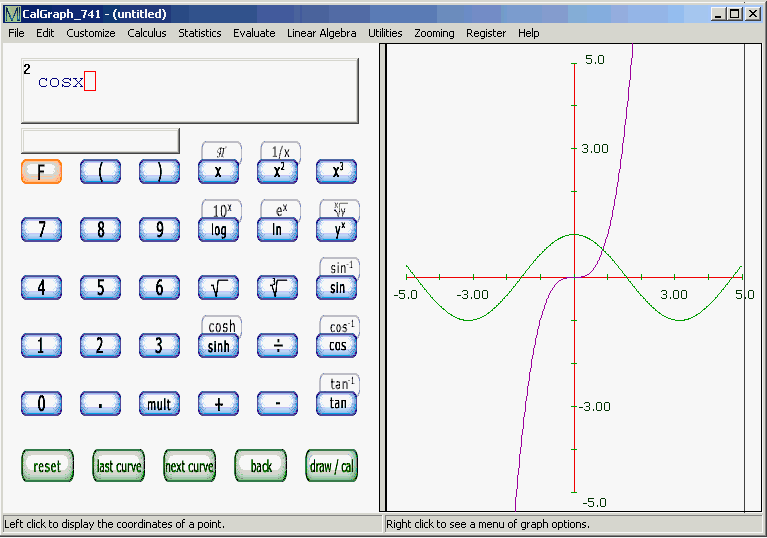
Now I see both curves.

Just in case, I save what I've done so far, clicking File, then Save, typing the file name twographs and clicking Save.
I have the graph, and I can see that the two curves cross. It looks like x is a bit less than 1, and y is near 0.6 or 0.7. But it is hard to be sure.
To zoom in on the crossing point, I click Zooming on the menu and then Zoom In (Drag Mouse).

I move the mouse near the point (0, 1) and hold down the mouse button while I move the mouse to
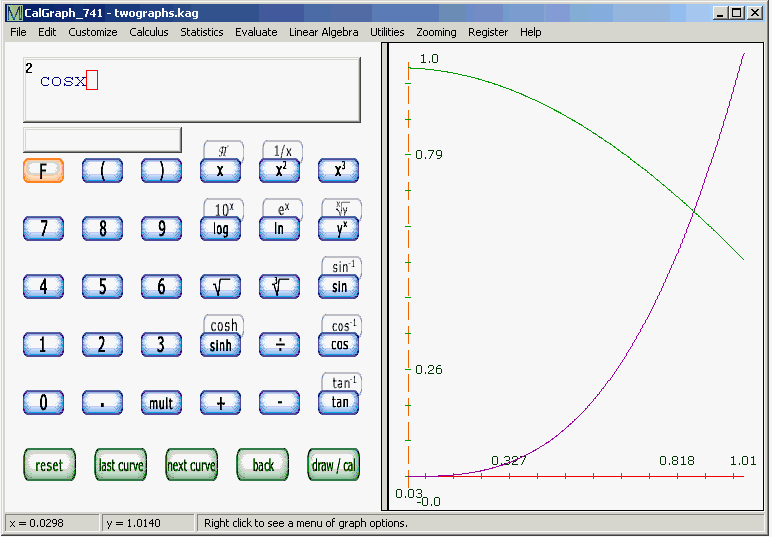
(1, 0). This draws a rectangle. When I let go of the button, I get this graph.

The x and y scales are magnified, but a bit hard to read. Still I can see that x is about 0.818 and y is near 0.65
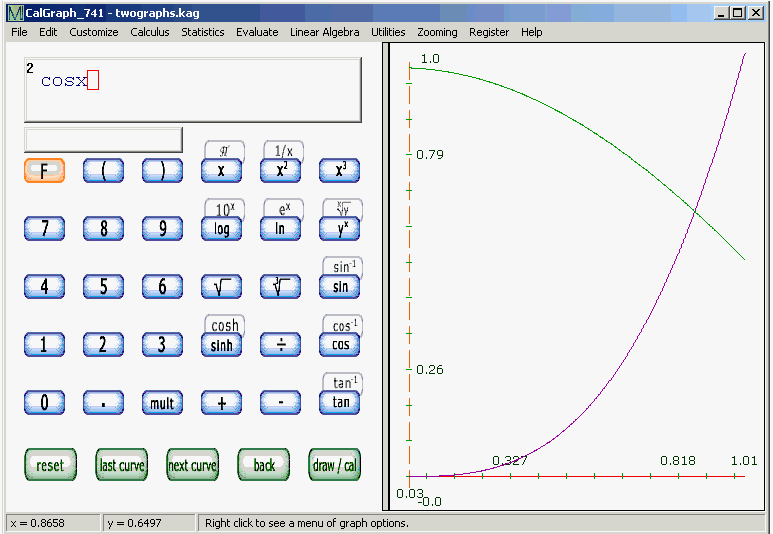
To save myself the trouble of reading from the x and y axes, I move the mouse so the cursor is as close to the crossing point as I can get and I click.

In the lower left corner it says x = 0.8658 and y = 0.6497
I can check the answer too: ( 0.8658 )3 = .6490 and cos 0.8658 = 0.6480 (using radians)
Not exact, but pretty close.
I could zoom in more and click again to be more accurate.