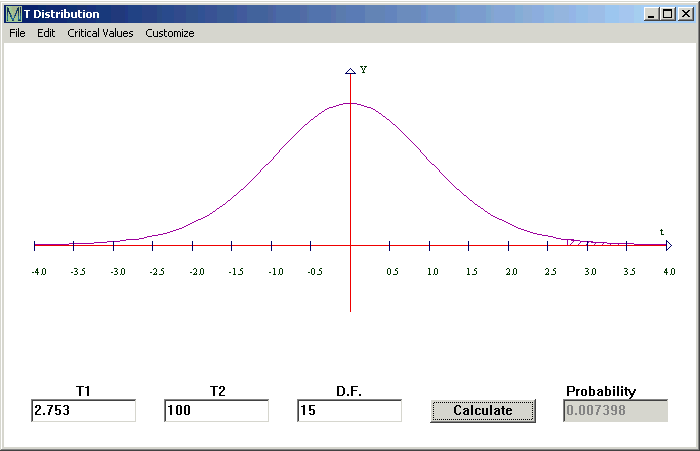
An example of a hypothesis tested using p-value:
Time magazine recently claimed that in the USA, 15 000 (or fewer) couples get married on an average weekend. Test this claim using a = 0.05 and this data: a random sample of 16 weekends found an average of 16 583 weekend weddings, with a standard deviation of 2300.
16 583 is well above 15 000, so it looks like Time might be wrong. But the data are based on only 16 weekends; perhaps there are too few data to make that decision.
The Null Hypothesis: the mean weddings per weekend is less than or equal to 15 000.
The Alternative Hypothesis: the mean weddings is more than 15 000: m > 15000
Because the data is an average of 16 data, use the Student T distribution, with the test statistic being

Here the average is 16583, the theoretical mean is 15000, the standard deviation is 2300 and there are 16 data.

I clicked Statistics > T Distribution and then entered the data. The T1 is 2.753, the T2 is infinity, so I put in 100, and the Degrees of Freedom is 16 - 1 = 15.
I clicked Calculate.

The Probability in the grey box is 0.007398
0.007398 < 0.05 that is, the p-value is less than the a. This means Reject the Null Hypothesis.
The mean number of American weddings per weekend is more than 15 000.