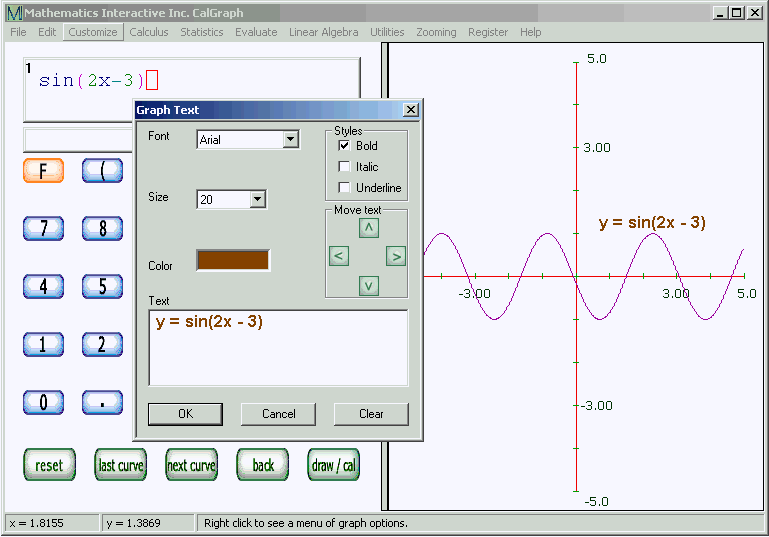
You can print a comment on your graph. At the top of the CalGraph window, click Customize and then
Graph Text. You get a window like this:

Type the text you want in the big Text box at the bottom. It will appear on the graph itself too.
You can drag the text with the mouse to wherever you want it on the graph. You can use the green arrows to move it also.
Checking Bold, like I did, changes the look of the text. So do Italic and Underline. Change the size of the text by clicking the little black arrow in the Size box and selecting a larger or smaller number. You can change the font, by clicking the little black arrow in the Font box.
The Color box is a bit more sophisticated. Click on the colored square to open this window:

If you like one of the Basic Colors, click it and then OK. Your text is in this color.
You can click in the multicolored square to pick a precise color and then adjust its brightness using the slider on the right. To save it click Add to Custom Colors. Once you have the color you want for the text, click OK.
To do several comments on a graph, or to add the math symbols like x2, it is best to copy the graph into a graphics program like Paint. You can make the math symbols in Paint, or in Word (or another word processor) and cut and paste them onto the graph in the Paint program. It sounds harder than it is.