You may be drawing several graphs together and want different values of x for each one. A common reason for this is to draw a Piecewise Function or a Step Function. It is not hard to do, but it takes several steps. An example will give you the idea.
Suppose I want to graph the Piecewise function:
![]()
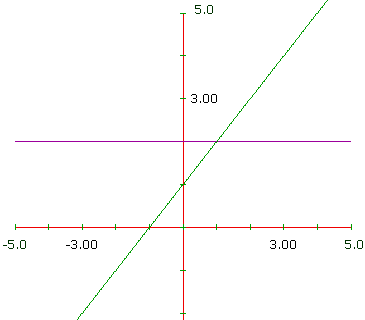
First I put in the two graphs. I click 2 and draw/cal to get a purple line for y = 2.
Then I click next curve x + 1 draw/cal to get the green line.

Now to restrict the domains of each line.
I click Customize and then Curve Domains/Range. I click the box beside Domains of all curves identical so it is not checked.
I click the ![]() so the box beside it says 1 for curve 1 (the
2 in the next box is the formula).
so the box beside it says 1 for curve 1 (the
2 in the next box is the formula).
The Xmin stays -5 but I change the Xmax to 1 and click Apply. Now the purple line stops where x = 1.
I click ![]() and now the boxes beside say 2 (for curve number
2) and x+1
and now the boxes beside say 2 (for curve number
2) and x+1
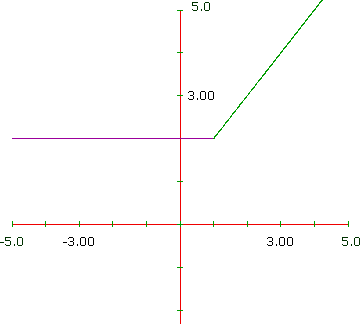
I change the Xmin to 1 and click Apply. The graph now looks like this.

It would look better if I changed the color so the graph is all one color.