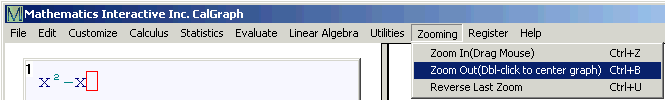
Click on Zooming and then Zoom Out.
The cursor changes to a cross ![]()
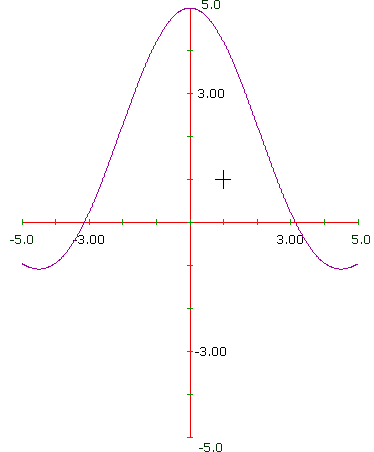
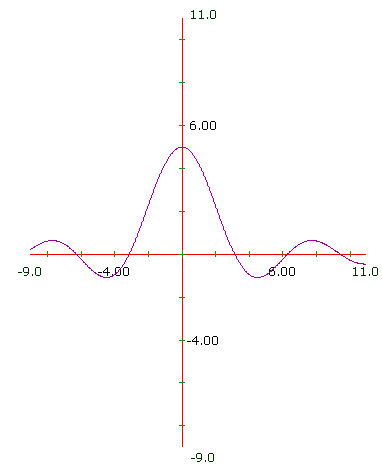
Double-click somewhere in the graph and you will get a new graph with the x-axis and y-axis both twice as long. The center of the new graph will be the point you double-clicked.
You can also reach Zoom Out by right-clicking anywhere on the graph.
If you want to be specify the x and y values for the graph precisely, click on Customize and then
Curve Domains/Range.