Mathematics Interactive's Graphing Calculator
All in one Financial, Statistical, Graphing Calculator with Curve-Fitting, Calculus, Vectors, Matrices and Conversions.
The interface of CalGraph, our Graphing Calculator, is truly simple. The graphs are dazzling and every feature is a click or two away. There are neither any key combinations to memorize nor a programming language to master. Our competitors charge more for something similar to a single one of our modules done not nearly as well.
CalGraph has been battle-tested and crash proofed for two years in the Mathematics Lab of John Abbott College (a junior college near Montreal, Quebec, Canada).
Download an absolutely free, fully enabled Graphing Calculator which you can use for 30 days.
Then buy it soon while the introductory price of $24.99 US lasts. Why so cheap? As you know, Mathematicians are crazy and programmers even crazier. Also, CalGraph was created and tested over a long period of time by a few individuals, not a company with the overhead of offices, support staff etc.
System Requirements: If your computer can run Windows XP or Vista with a few programs open at the same time, you are OK. More formally: Any flavor of Windows from 98, 1.5+ GHz processor, 0.5+ GHz RAM
Features:
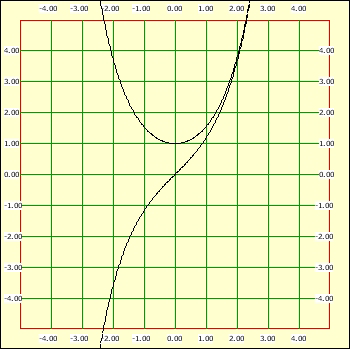
 Breathtakingly beautiful graphs. Print your graphs or paste them directly into your projects. There is no limit to the number of graphs which can be drawn at the same time*.
Customization: Change colors, domain and range, axis type and lots more with a couple of clicks more...
Ease of use
Our interface looks just like a hand-held graphing calculator, but is, believe it, far simpler to use. (You don't need to memorize any commands.) example ...
Input: Type or click buttons or both. more...
Click for Coords and Zooming
You can click at any point of a graph to get its coordinates, a handy feature in finding intersections (especially when impossible to do algebraically). Zoom for greater accuracy.
Save your graphs to modify later or export to bmp, gif, jpeg, png
WYSIWYG printing for graphs more...
Relaxed syntax: We recommend that you use correct Mathematics syntax, in particular, for complex expressions.
However, if you need a quick graph, for example of y = sin(x), you can get away with simply clicking
(or typing) "sin" and pressing "Enter".
Error-checking: While we try to allow for "relaxed" syntax, if you make an error, you will get a message
suggesting a correction. more...
Help Files
You really won't need them to use the program, but they are nice to have in case we are wrong about something being obvious. You'll get a complete set to use on your computer or see them on this website. more...
Curve Fitting
Save your data into an Excel file. Open CalGraph, select one of the curve fitting options, set the file name and press "Enter". See how.
Statistics
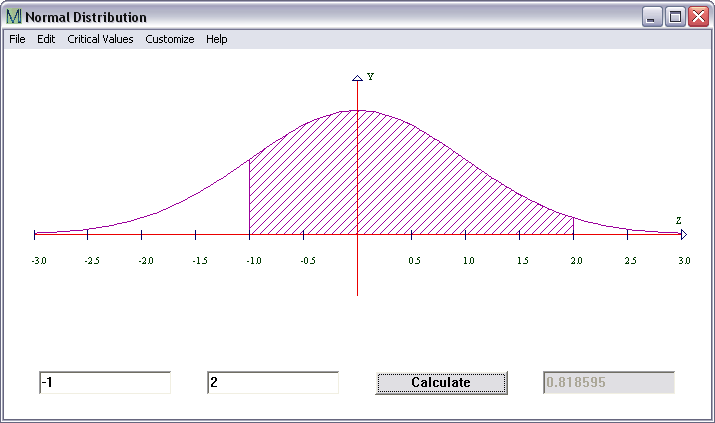
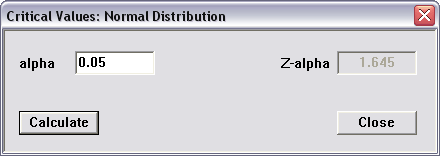
It seems crazy in the 21st century to have to have to carry around a Statistics book and look up values in the tables at the back of the book. CalGraph calculates Normal, F, t and Chi-Square distribution values as well as their
critical values.
Print their graphs or copy/paste them directly into your projects.


Linear Algebra
The common functions for matrices and vectors are all here with no commands to memorize. You can preview vectors and matrix calculations before printing and also copy/paste matrices and vectors into most common text and graphics editors such as Word and PhotoShop.
Conversions
CalGraph performs all the common conversions e.g.
Distance,
Mass,
Energy and
Volume
(and more) as well as some uncommon ones such as Number System Conversions. We have taken care to avoid round-off errors.
more...
Financial Math
Calculate your loan payments, interest on deposits etc. Compound interest can be simple!
See an example
Calculus (Numerical Integration and Differentiation)
It is helpful to see a function and its derivative graphed together. CalGraph also calculates the area under a curve.
Profiles
Instead of setting the colors of the graphs, graph background, labels, domains and range and all the other options, each time you open the program, you can save your settings.
Miscellaneous Features
Graph Text
Tool Tips
Quick Evaluate
There are many ways to do a quick calculation without a graph, one being to use Quick Evaluate.
|
|

|

|
|


